Wearable capacitive pressure sensor for human physiological signal collection
Wearable capacitive pressure sensor for human physiological signal collection
In recent years, high-sensitivity pressure sensors with flexibility, biocompatibility and stretchability have attracted widespread attention in the fields of wearable electronic devices and smart skins. However, it is a considerable challenge to achieve both high sensitivity and low cost of the sensor, and to obtain the best mechanical stability and ultra-low detection limit for use in delicate physiological signal monitoring equipment. In response to the above problems, this article reports a simple preparation method of a high-sensitivity and high-reliability capacitive pressure sensor (CPS) for ultra-low pressure measurement. TrFE) composite nanofiber scaffold (CNS) sandwiched between biocompatible poly(3,4-ethylenedioxythiophene) polystyrene sulfonic acid (PEDOT:PSS)/polydimethylsiloxane (PDMS) electrodes Between as a dielectric layer. The prepared sensor has a high sensitivity of 0.51 kPa-1 and a minimum detection limit of 1.5 Pa. In addition, it can also achieve linear sensing in a wide pressure range (0-400 kPa), and achieve high reliability during 10,000 cycles even at ultra-high pressure (greater than 167 kPa). Compared with the original PVDF-TrFE nanofiber scaffold, the sensitivity of the nanofiber-based sensor can be improved by loading with MXene, thereby increasing the dielectric constant to 40 and reducing the compressive modulus to 58%. This sensor can determine the health of patients by monitoring physiological signals (pulse rate, respiration, muscle movement, and eye twitches), and is a good candidate for the next generation of human-machine interface devices.
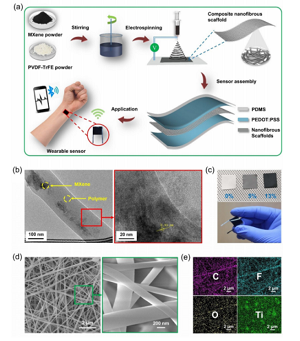
Figure 1. Preparation process and structure of CNS-based pressure sensor. (A) Show the schematic diagram of the preparation process of CNS-based pressure sensor. (B) TEM image of CNS, showing single-layer and multi-layer MXene nanoflake. The inset is a high-resolution TEM showing the 0.93 nm interlayer spacing corresponding to the MXene (002) plane. (C) The photo shows the CNS of different MXene concentrations and the manufactured sensor. (D) FESEM image of CNS. The inset shows the morphology at higher magnification. (E) The EDS diagram of the composite nanofibers shows the elements C, F, O and Ti.
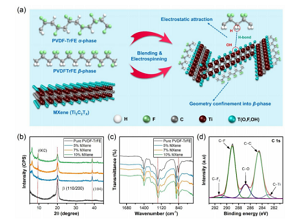
Figure 2. Schematic and surface features of CNS. (A) A schematic diagram showing the synergy obtained after introducing MXene into the polymer matrix. (B,c) XRD and FTIR analysis of CNS at various MXene concentrations. (D) XPS spectrum of the C 1s region of CNS containing 5 wt% MXene concentration.
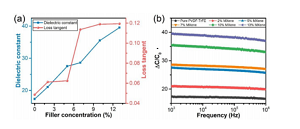
Figure 3. Electrical characteristics of different samples (a) The dielectric constant and loss tangent of CNS relative to MXene content (in wt%). (B) Frequency dependence of dielectric constant.
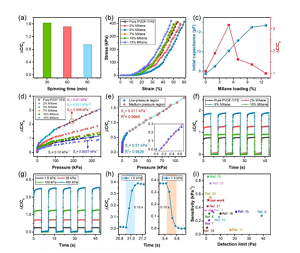
Figure 4. Electromechanical characteristics of CNS-based pressure sensors. (A) Performance comparison of CNS-based sensors based on different electrospinning times. (B) The compressive stress-strain performance of the sensor under a stable load with a compression distance of up to 0.4 mm. (C) The initial capacitance (C0) and relative change (ΔC/C0) of the CNS-based sensor depends on the MXene content (in wt%). (D) The relative capacitance change (ΔC/C0) of CNS-based sensors containing dielectric layers with different MXene concentrations (in wt%) under a constant compression distance of 0.4 mm. (E) A descriptive graph of ΔC/C0, illustrating the pressure sensitivity obtained when the MXene loading is 5 wt%. The illustration shows the sensitivity of the sensor in the low pressure area. (F) For different MXene concentrations, the cyclic capacitance response (loading/unloading) of CNS-based sensors at a constant compression distance of 0.3 mm, and (g) At different loading/unloading pressure values, the MXene concentration is 5 wt % Of the cyclic capacitance response of the CNS-based sensor. (H) Response and relaxation time in a load/unload cycle with a pressure of 1.5 kPa. (I) Compared with the previous report, the performance of the sensor in terms of sensitivity reported at low detection limits in the low pressure range.
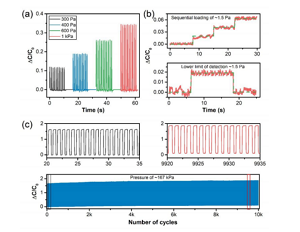
Figure 5. (a) The relative change of capacitance response under low-voltage loading and unloading cycles. (B) Illustrate the lower limit of detection (LOD) by sequentially loading and unloading approximately 38 mg of long grain rice. (C) Cyclic stability test of CNS-based pressure sensor after 10,000 loading and unloading cycles under high pressure of about 167 kPa (greater than 40% compression). The inset shows the selected cycle at the beginning and end of the stability test.
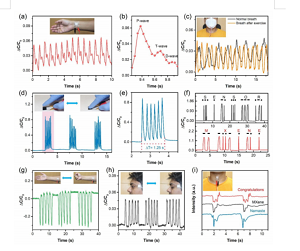
Figure 6. The application of CNS-based sensors in continuous and real-time monitoring of human physiological signals. (A) Real-time monitoring of arterial pulse wave. Illustration: Photo of the sensor attached to the skin area of the wrist. (B) An enlarged view of a single pulse waveform, including detailed information about its characteristic peaks. (C) Monitor breathing before and after exercise. Illustration: A photo of a sensor attached to a mask to monitor breathing rate. (D) The diagram shows that the sensor simulates finger tapping at a static tremor frequency of 4.8 Hz to detect primary Parkinson's disease. Illustration: A photo that imitates a finger tapping the surface of the sensor at a constant frequency. (E) A zoomed-in image that simulates percussion at a specific tremor frequency of 4.8 Hz. (F) Short press and long press on the sensor can generate international Morse code signal. (G) Monitor muscle contraction and expansion by reversibly opening and closing the fist. Illustration: Photo of the sensor attached to the abdominal wrist muscles. (H) Monitor the signal generated by the vibration of the eye muscles during eye twitches. Illustration: A photo of the sensor attached to the skin of the eye. (I) The sensor's ability to recognize different sounds with repetitive and different waveforms. Illustration: Photo of the sensor attached to the epidermis of the throat.

